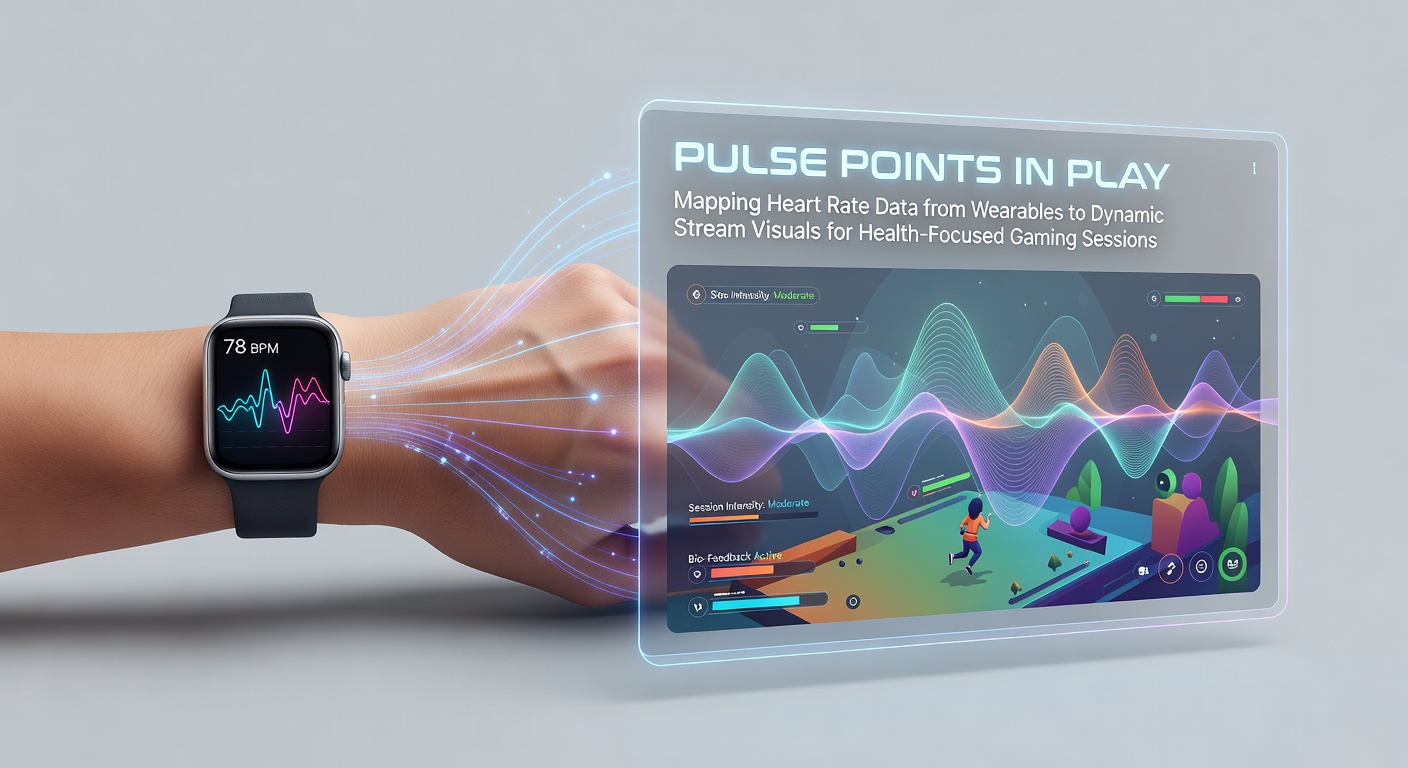
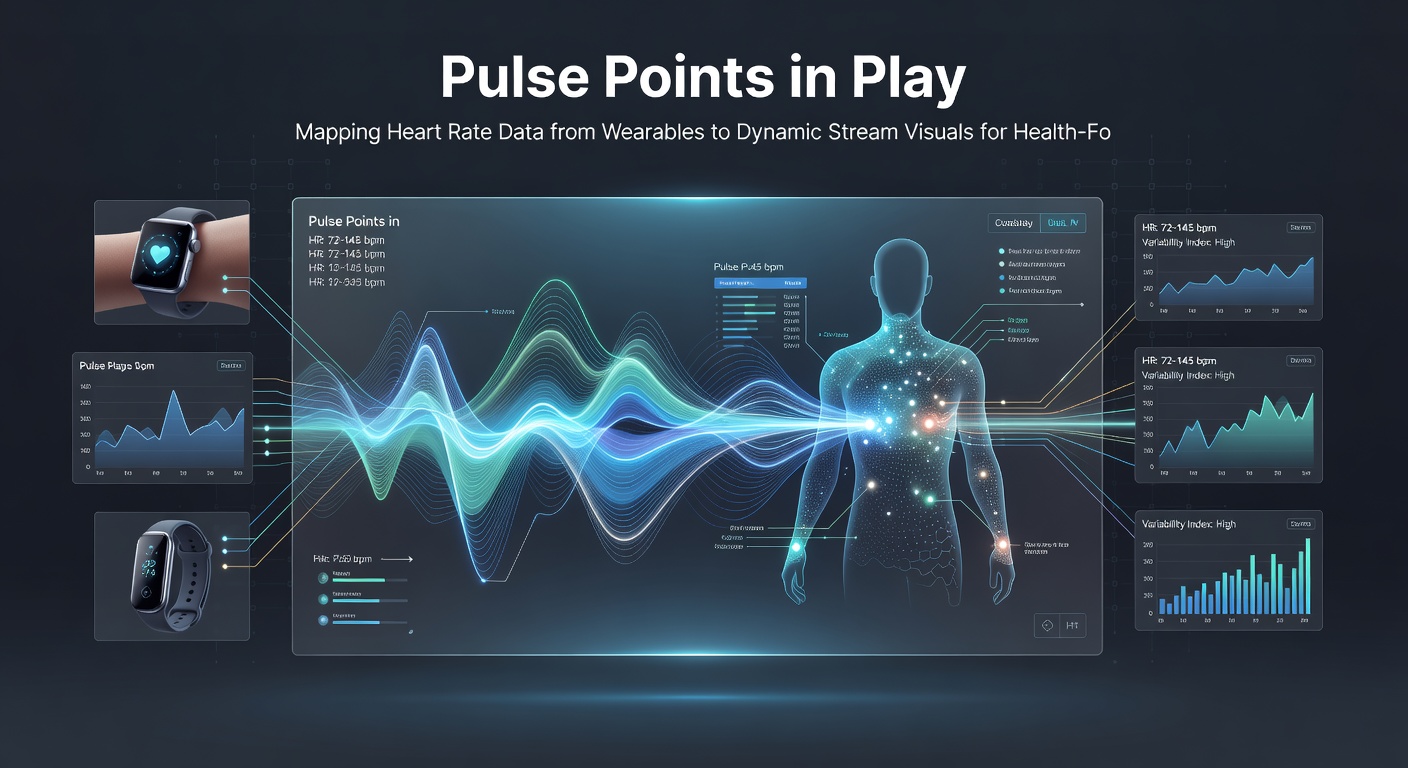
Pulse Points in Play: Mapping Heart Rate Data from Wearables to Dynamic Stream Visuals for Health-Focused Gaming Sessions
Developers and streamers have begun connecting consumer wearables directly to broadcast overlays, which turns raw heart rate numbers into shifting colors, pulsing borders, and animated graphs that update in real time for viewers.
Hardware from major manufacturers feeds data through open APIs, while streaming software such as OBS Studio and Streamlabs Desktop accepts those inputs and maps them to visual layers without additional plugins in many current builds. Researchers at several universities have documented how these mappings help audiences interpret exertion levels during extended play sessions.
Technical Integration Pathways
Bluetooth Low Energy connections allow devices to transmit beats-per-minute values at one-second intervals, and developers route that stream through middleware that converts the integers into HSL color shifts or particle effects on screen. One setup pairs a chest-strap sensor with a small Node.js script that pushes JSON packets to a browser source, which then alters background saturation as the player’s rate climbs above 120 bpm.
Cloud services introduced in late 2025 now handle the translation step on remote servers, reducing local CPU load and letting mobile gamers participate without dedicated capture hardware. Data shows that latency remains under 300 milliseconds in most tested configurations, which keeps the visual feedback synchronized with on-screen action.
Viewer Engagement Patterns
Analytics from platforms hosting health-oriented channels indicate that overlays displaying live biometric feedback increase average watch time by noticeable margins during endurance-style challenges. Observers note that chat messages referencing the changing graphics appear more frequently when the visuals include simple thresholds, such as a green-to-red gradient that activates at 140 bpm.
Moderators in several communities have adopted quick-reference guides that explain the color scale to new viewers, which reduces confusion while maintaining the immersive quality of the broadcast. These guides often appear as static side panels that update only when the streamer crosses a new heart-rate zone.
Health Monitoring Considerations
Medical organizations including the American Heart Association publish zone guidelines that streamers reference when setting visual triggers, ensuring the overlays align with established cardiovascular categories rather than arbitrary numbers. European researchers have examined similar integrations and reported that participants who viewed their own rate data during gaming reported greater awareness of physical limits.
Privacy controls built into current wearable firmware let users restrict data sharing to specific applications or sessions, which addresses concerns raised by data-protection agencies in multiple regions. Streamers typically display only anonymized ranges or artistic representations instead of exact figures when broader audiences are present.
Developments Anticipated for May 2026
Industry events scheduled for May 2026 will feature updated SDK releases that support multi-device aggregation, allowing simultaneous input from wrist and chest sensors to generate composite visuals such as layered waveforms. Trade groups have announced workshops focused on standardizing color-mapping protocols so that viewers switching between channels encounter consistent visual language.
Academic teams from institutions in Australia and Canada are preparing longitudinal studies that track whether regular exposure to these overlays correlates with measurable changes in player hydration habits or session length. Preliminary registration data for the studies shows participation from both professional and recreational streamers.
Implementation Examples
One documented workflow uses a popular fitness watch model paired with a custom Lua script inside a streaming application, where heart-rate values above 150 bpm trigger a subtle screen-edge glow that fades once the rate drops. Another approach routes data through a dedicated mobile app that exports a WebSocket feed, which browser sources consume directly for real-time particle density adjustments.
These setups require initial calibration to match individual resting rates, yet once configured they operate without further input during most sessions. Technicians at several production studios have published step-by-step configuration files that reduce setup time to under fifteen minutes for users familiar with basic streaming tools.
Conclusion
The mapping of heart-rate information from wearables to live visuals continues to evolve through incremental hardware and software improvements that prioritize both engagement and user control. Ongoing research and upcoming platform updates scheduled through 2026 are expected to refine synchronization accuracy and expand compatibility across additional device ecosystems while maintaining established health-data guidelines.